
System Mechanic® demonstrably improves the performance of the four principal components of a PC.
This paper is the result of iolo Labs comprehensive and reproducible benchmark testing, with results that users can examine for themselves.
The text and images below are a copy of an article from the website of iolo, the maker of System Mechanic PC optimization software.
Purpose
To show computer performance improvement using iolo’s System Mechanic software to repair and optimize Windows PCs.
- Beginning with version 16.5, System Mechanic has been re-written from the ground up, with every feature in the product re-engineered for improved functionality and performance.
- Includes new optimization features for Windows 10, designed to increase privacy and reduce internet bandwidth demands.
This paper is the result of iolo Labs comprehensive and reproducible benchmark testing, with results that users can examine for themselves.
Tests were conducted that specifically showed performance improvement of:
- PC Boot Time
- Internet (Download Speed)
- CPU (Processor)
- RAM (Memory)
- GPU (Graphics)
- Drives (HDDs and SSDs)
Methodology
- Install commonly used programs (41) and browser add-ons (6) to replicate an in-use PC, in a manner that is reproducible and produces consistent results.
- Installed software includes:
Security software, VPN software, PDF readers, gaming and entertainment platforms, media players/editors, productivity applications, etc.
- Installed software includes:
- Collect performance metrics on the reproduction of an in-use PC before applying System Mechanic
- Collect performance metrics on the reproduction of an in-use PC after optimizing with System Mechanic
- Run each test 5 times before and 5 times after System Mechanic installation, remove the highest and lowest scores, and then average the remaining 3 to calculate final scores.
- Report improvements (in each test) after PCs have been optimized.
Test Specifications
Hardware:
Convertible Tablet
- OS: Windows 8.1 (6.3.9600)
CPU: Intel Atom Z3745 @ 1.33Ghz
RAM: 2GB
Storage: 29GB Hynix HBG4e SSD
Graphics: Intel HD Graphics
Desktop
- OS: Windows 10.0.14393
CPU: AMD FX8300 8-core @ 3.3Ghz
RAM: 16GB
Storage: OCZ Vertex 450 SSD (120GB)
Graphics: NVIDIA GeForce 8400GS
Ultrabook
- OS: Windows 10.0.14393
CPU: Intel i53317U @ 1.7Ghz
RAM: 4GB
Storage: 341 GB HDD w/SSD cache
Graphics: Intel HD Graphics 4000
Notebook
- OS: Windows 7 (6.1.7600)
CPU: Intel U2300 @ 1.2 Ghz
RAM: 2GB
Storage: 112GB HDD
Graphics: Mobile Intel 4-series
Software:
Windows Event Logs
To measure Windows startup times
GeekBench 4 by Primate Labs
GeekBench is focused on testing the performance of CPUs. It runs workloads that model real-world tasks (e.g., running applications) in order to offer meaningful, real-world like, results..
GeekBench is used by organizations to demonstrate the processing capabilities of their products.
NovaBench 3 by Novawave Inc.
NovaBench tests the four primary components of a PC. On completion, it scores the PC based on an aggregate sum, and also offers individual scores for each component.
Its test perform floating point arithmetic, integer arithmetic, and MD5 Hashing to evaluate CPU performance.
It tests graphics processing units (GPUs) for 3D Graphics, RAM for read and write speed, and write speed of storage devices.
PerformanceTest 9.0 by PassMark Software
PerformanceTest evaluates the four primary components of a PC, running 32 various sub-tests in the process.
To measure a CPU’s capabilities it runs mathematical operations, compression, encryption, and physics.
To measure graphic performance it tests vectors, bitmaps, fonts, text, GUI elements, and DirectX 9 to DirectX 12 in 4K resolution.
To measure drive performance it tests reading, writing & seeking within disk files + IOPS.
It benchmarks access speeds and latency to system RAM.
Heaven 4.0 by Unigine Corp
Heaven Benchmark is a GPU benchmark program used to evaluate graphic (i.e, gaming graphics) performance.
It stresses graphic cards to their limits to determine the stability of a GPU under extreme conditions.
In addition to an overall score, it also measures Frames Per Second (FPS).
Internet Benchmarking sites
OOKLA’s SpeedTest.net – (http://www.speedtest.net/)
DSLReports – (https://www.dslreports.com/speedtest)
MeasurementLab.net [mLAB] – (http://www.measurementlab.net/tools/ndt/)
Speedof.me – (http://speedof.me/)
System Mechanic (16.5.1.27)
To repair and optimize test PCs.
Windows Startup Time
Windows’ Event Viewer (Applications and Service Log\Microsoft-Windows-Diagnostics-Performance/Operational, Event ID100) was used to record boot-up times.
Startup (Windows Boot) Speed
Improvement (%) after running System Mechanic
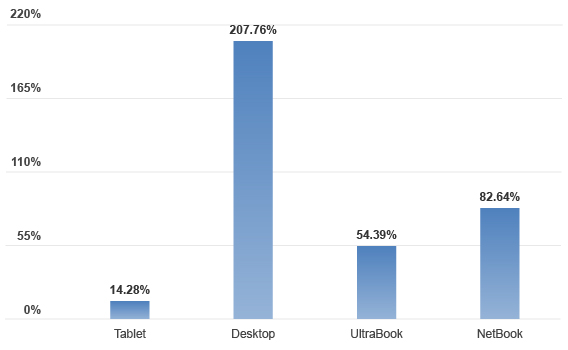
Key Findings
Optimizing the PCs with System Mechanic has a dramatic positive impact on the time to boot a Windows PC.
For example, the Windows 10 Desktop took 148.4 seconds to boot, but after running System Mechanic the PC was up and running in 48.2 seconds – over 200% faster.
The total aggregate score (across all PCs) for Startup Time was: 89.77% improved.
Internet Speed
Four popular download speed test websites were used to evaluate the performance improvement on a system optimized with System Mechanic.
A common browser was used to separately visit each site and run their speed measurement tests.
Download Speed
Improvement (%) after running System Mechanic
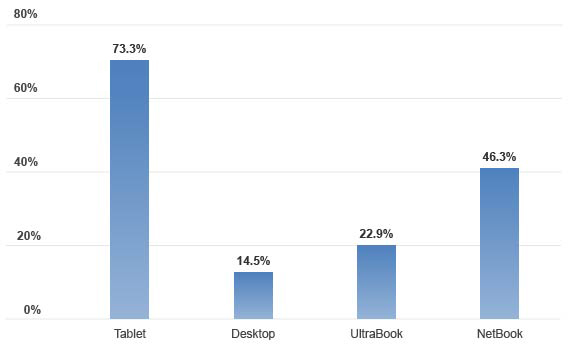
Key Findings
Internet download speeds increased considerably across all devices.
Each PC saw at least 14%+ improvements.
3 of 4 PCs realized over 20% faster downloads.
The total aggregate score (across all PCs) for Internet Speed was: 39.25% improved.
CPU Performance
Benchmarking tools NovaBench, PerformanceTest, and GeekBench (2 separate tests – Single Core and Multicore) include CPU stress tests in which they perform tasks such as compression, encryption, floating point arithmetic, integer arithmetic, and MD5 Hashing.
CPU Performance
Improvement (%) after running System Mechanic
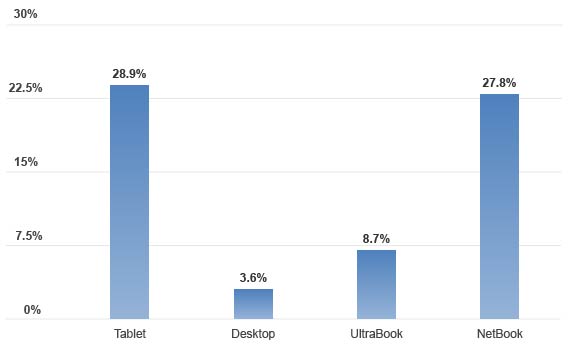
Key Findings
The Desktop, with an 8-core processor, realized modest 3.6% gains
The PCs with 2-4 cores had improvements near 30%
The total aggregate score (across all PCs) for CPU Performance was: 17.25% improved.
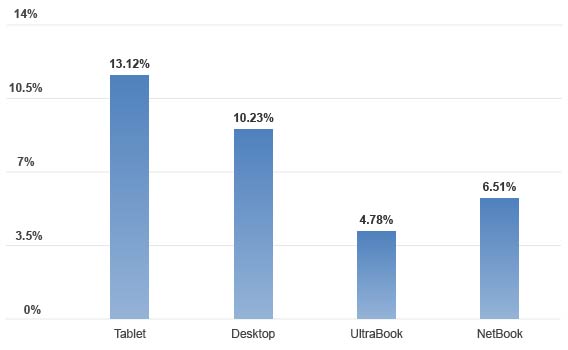
RAM Performance
NovaBench and PerformanceTest offer RAM benchmarking evaluations in which they measure latency, and read and write speed to system memory.
RAM (Memory) Performance
Improvement (%) after running System Mechanic
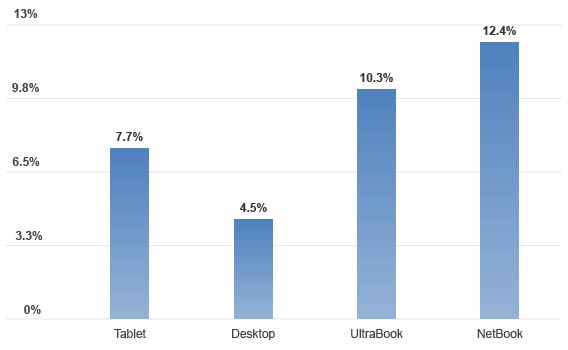
Key Findings
The Desktop with the most RAM (16GB) realized the least benefit, but was still improved by 4.5%.
The PCs with 2-4GB of memory had sizable increases in RAM performance directly related to optimizations made by System Mechanic.
The total aggregate score (across all PCs) for RAM Performance was: 8.73% improved.
GPU (Graphics) Performance
Heaven, NovaBench and PerformanceTest (2 separate tests – 2D and 3D) were aggregated for each platform tested.
Heaven scores the system in Frames-Per-Second (FPS), a popular measurement mechanism often used by PC gamers.
PerformanceTest, in its two tests, evaluates the graphic performance using tests that stress image vectors, bitmaps, fonts, text, GUI elements (2D), and DirectX 9 to DirectX 12 in 4K resolution (3D).
Graphics (GPU) Performance
Improvement (%) after running System Mechanic
Key Findings
All the PCs tested showed significant positive improvements across most of the benchmarks.
The total aggregate score (across all PCs) for GPU (Graphics) Performance was: 8.66% improved.
Drive Performance
PerformanceTest and NovaBench measure drive performance by testing read, write & seeks within disk files + IOPS (Input-Output operations per second). Scores from the tools were aggregated for each platform tested.
Drive (Primary Storage) Performance
Improvement (%) after running System Mechanic
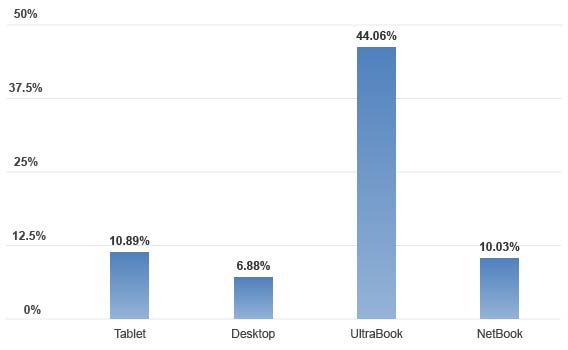
Key Findings
The Desktop has a high performance SSD as the primary storage device, and therefore realized limited improvement.
The UltraBook’s HDD averaged performance gains of over 44%. (This PC’s SSD is used as a cache, not a primary storage drive).
The lower performance SSD- and HDD-based systems saw significant increases.
The total aggregate score (across all PCs) for Drive Performance was: 17.97% improved.
Conclusion
System Mechanic v16.5 demonstrably improves the performance of the four principal components of a PC.
The improvements quantified by the benchmarking software programs may deliver a faster PC with enhanced performance during a potentially wide array of tasks, including gaming, rendering, streaming, graphic design, office tasks and more.
In addition to increased system responsiveness, common user actions, including booting the PC and web browsing, were improved considerably across all systems tested.
REFERENCES
PC Mag:
http://www.pcmag.com/article2/0,2817,2371043,00.asp
http://www.pcmag.com/article2/0,2817,2371155,00.asp
Top10Reviews:
http://www.toptenreviews.com/software/utilities/best-pc-system-utilities-software/system-mechanic-review/
http://www.toptenreviews.com/software/utilities/best-pc-system-utilities-software/